Grafiki - Threat Hunting Tool About Sysmon And Graphs

Grafiki is a Django project about Sysmon and graphs, for the time being.
In my opinion EventViewer, Elastic and even Kibana, are not graphic enough. The current threats are complicated and if attackers think in graphs, defenders also must do it.
This is a proof of concept, the code was not debugged jet but maybe could be useful for someone, I will improve it.
This project started such as EVTX parser to SQL database and this maybe it is the core of the project.
Goals
- Parse Sysmon events from EVTX files and from URL to relational database.
- Parse Elastic Sysmon events to relational database.
- Easy Elastic filters creation.
- Create graphs from database using Vis.js.
- Offer filters to easy work with graphs.
- Show events sequentially.
- More
Current Status: Pre-alpha
The project is not mature enough, although it works, test plan is not defined jet.
Any opinion, bug found, improve request ... will be welcome.
Docs
- User manual [To-Do]
License: GPL-3.0
Author
- Luis F. Monge @Lukky86
Acknowledgments
- Roberto Rodríguez (HELK & Mordor Projects) Cyb3rWard0g
- Samir Bousseaden (EVTX Samples) SBousseaden
Installation
git clone https://github.com/lucky-luk3/Grafiki.git
cd Grafiki
chmod +x setup.sh
sudo ./setup.sh
--- wait ---
cd grafiki
python3 manage.py runserver
In your browser go to http://127.0.0.1:8000/
Hunt, learn and enjoy!
To-Do
- Add events 2,6,8,15,23.
- In memory PostgreSQL database .
- Integration with Elastalert.
Information
This application can process two types of files.
- Sysmon EVTX files from disk or from a URL.
- Sysmon Filebeat event files from disk or from URL. Also, this application has two types of processing:
- Normal process
- Simple process In normal process, each process generates one node in graph view, threats are represented in the graph and also it is represented a computer node with all his related processes .
In simple process, processes are grouped by name and threats are not represented in event 8 for example.
It's important keep this in mind because even simple view sometimes could be useful, other times could be confusing, for example when you has events from more than one computer.
Data schema

File List
In this page, you can upload evtx files or elastic event files and process it.

Examples
This page is useful for create a library of online samples files.
When you create an example, you put the url to the file and when you process it, the application download event file and process it.

Elastic
In this page, you can create searches to you Elastic instance and create a graph of the result. You can create filters about:
- Hostname of host machine.
- Sysmon event ID
- SourceIP
- DestinationIP
- DestinationIP Type (Internal or External)
- UserAccount
- Process Name All this filters can be inclusive or exclusive and can be contain group of values separated by commas.
You can create more than one filter and all of created filters uses "AND" such logical operator between each other.
In this page you can include Powershell Scripting Logging events in the results.

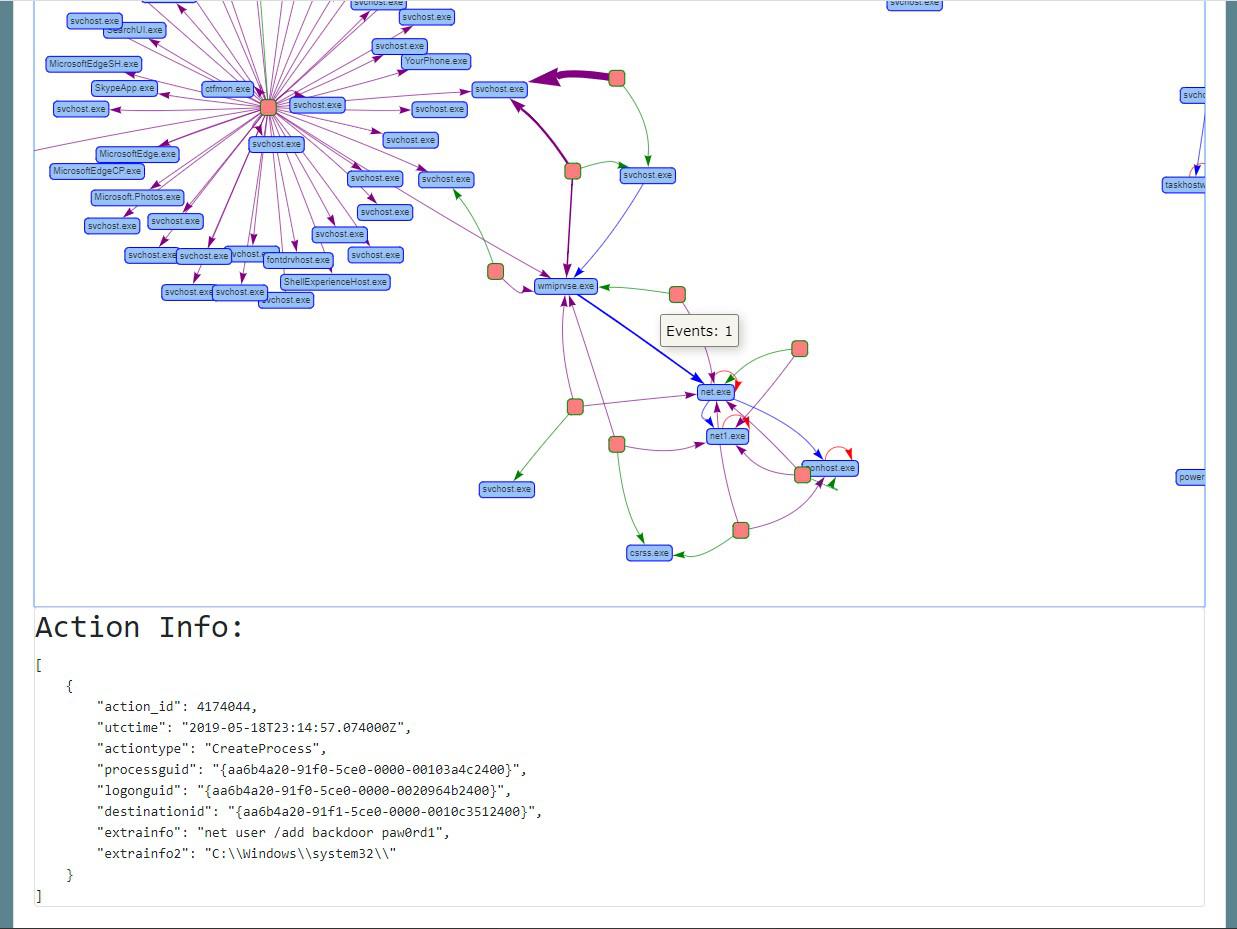
Graph
Graph page is the core of this application and the researching interface of it.
In the other pages you select your data and this pages send you to graph page, if you go directly to graph page, nothing will be there or the last data searched for you.
In this page are two tabs, one for sysmon and other for Powershell events.
There are two types of elements, nodes and edges. Nodes represent entities such process, file or registry key and edges represent actions such as create, delete or connect.
Sysmon
We are in the core.
This part use the information in the database to create graphs about the events analyzed.

You can navigate in the graph, watching about process creation, named pipes connected ... but there is usually too much information to work comfortably.
Inside the tab are a hidden section about graph filters.
Filters

In this area you can work with the graph filtering data.
You can filter nodes by this entities:
- Computer
- Process
- Threat
- Connection (IP)
- File
- Pipe
- Registry Key
- DNS Query
- DNS Resolution
You can filter process nodes also by:
- Process integrity
- Process session
- User
Also, you can filter edges by this actions:
- Create
- Finish
- Access
- Change
- Delete
- Rename
- Connect
- Owned (belongs to)
- Load
Animations
One great feature is create animations about the data in the graph, this is very useful for example in Parent PID Spoofing or when some user in a computer execute commands remotely.

Delete groups
When graph has too much information, is possible delete one node, one edge, a group of nodes or a group of nodes recursively.
Delete group of notes works selecting one node and the application will delete all de nodes that his parent is the selected node.
Delete group recursively works also selecting a node but application will go through nodes deleting until finish this tree branch. If branch has a lot of information, this will take a long time.
Graph Settings
On bottom of the screen it's possible to change physics of the graph.
When graph has a lot of information could be useful disable physics in order to stabilize the graph.
You can play whit physics, it's funny.
Powershell logging
In the Powershell tab is possible analyze powershell commands.
Commands are showed in an accordion and inside each row, if command contain a base64 command, it will be decoded and parsed.
You can search in all events for encoded o decoded part of the command.

Examples
Create process tree

Create remote thread

Named pipes connections

Computer network connections

Empire WMIC add user
 Reviewed by Zion3R
on
5:30 PM
Rating:
Reviewed by Zion3R
on
5:30 PM
Rating:


